
San Francisco Bay Area Residential Market Report - June 2026

Summer arrived early in the Bay Area housing market. May brought a surge of buyer activity across the nine-county region, inventory tightened further in core markets, and median prices climbed well above where they stood a year ago in several counties. The gap between fast-moving Peninsula homes and slower-paced Napa or Solano properties has rarely been wider. That divergence tells you a lot about where demand is concentrated right now.
Local Market Insight
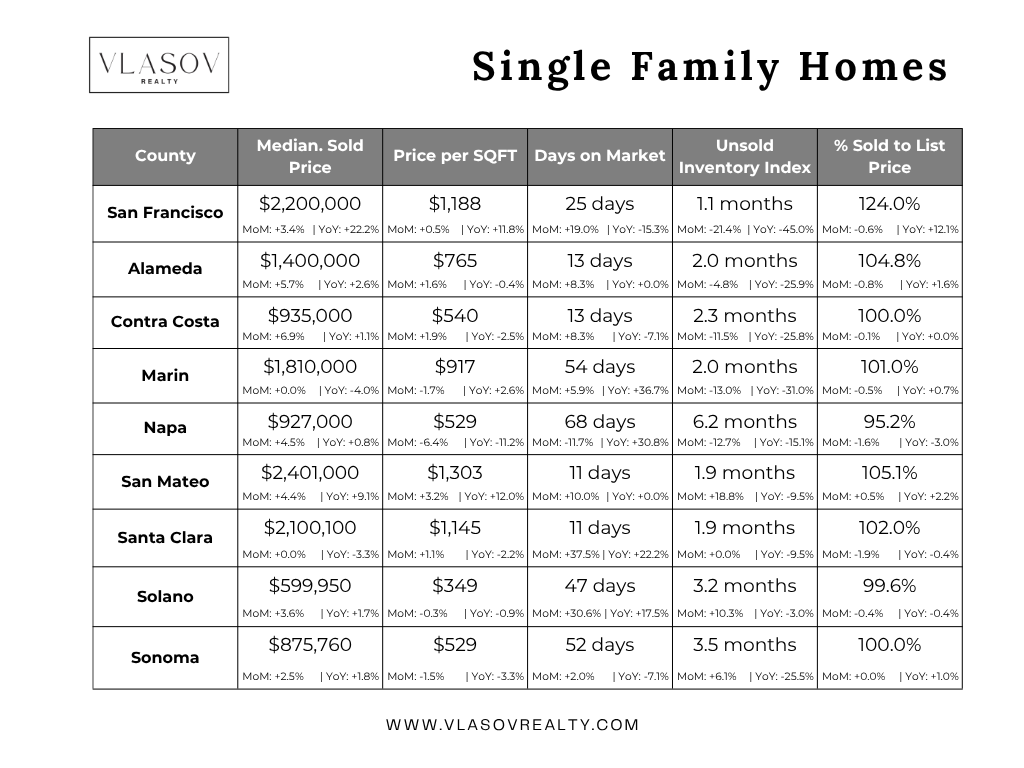
Single-family homes across the Bay Area posted strong price gains in May. San Francisco hit a median of $2,200,000, up 22.2% year over year. San Mateo County reached $2,401,000, up 9.1% from last May. Alameda County came in at $1,400,000, a 2.6% annual increase. These aren't outliers. They're the story of a region where inventory remains historically low and qualified buyers are competing hard for every well-priced listing. San Francisco's unsold inventory index dropped to 1.1, down 45% from a year ago. That is an extraordinarily tight market. Homes in Alameda moved in a median of 13 days. San Mateo listings cleared in 11 days. The sold-to-list ratio in San Francisco SFH hit 124% of asking price, meaning the average accepted offer was nearly a quarter above list.
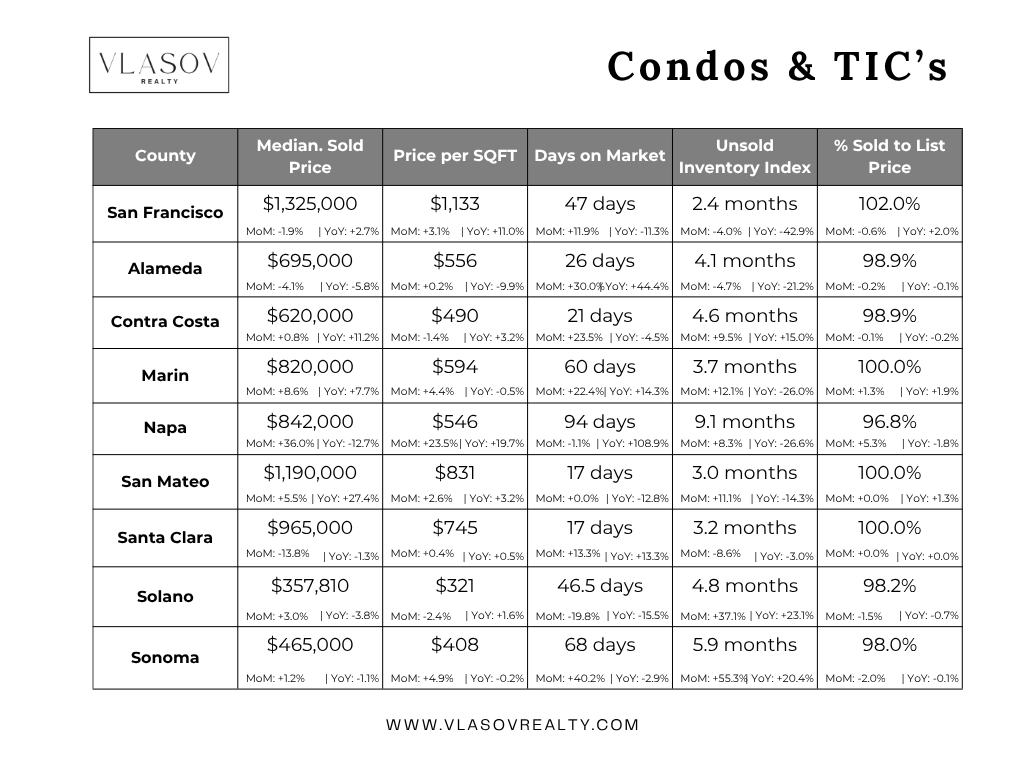
The condo and TIC market tells a more complicated story. San Francisco condos came in at a $1,325,000 median, up 2.7% year over year, but the category saw a 1.9% month-over-month price dip. Days on market for SF condos sits at 47, a significant contrast to the 25-day pace for single-family homes in the same city. Alameda County condos were a softer spot, with the median at $695,000, down 5.8% from a year ago and days on market expanding to 26. Contra Costa condos were a relative bright spot, up 11.2% year over year to $620,000 with a UII of 4.6, indicating more supply than the SFH side. The condo market, broadly, is offering buyers more time and more negotiating room than the single-family segment. That gap is real and meaningful for anyone weighing their options right now.
What's Driving the Market
- Inventory compression is the dominant force. San Francisco's SFH unsold inventory index of 1.1 and Alameda's 2.0 are among the lowest readings on record for this time of year. Across the Bay Area, the lock-in effect continues to keep potential sellers on the sidelines. About 77% of California homeowners hold mortgages below 5%, a rate they have little incentive to give up by selling. Supply is not coming onto the market at the pace buyers need.
- Tech sector employment is sustaining high-end demand. Bay Area tech hiring stabilized after the layoff cycles of 2023 and 2024. AI-driven companies have added headcount in San Francisco, Santa Clara County, and San Mateo County, keeping a pool of high-income buyers active in the market. The markets where those buyers concentrate, such as San Mateo and Santa Clara SFH, remain highly competitive despite mortgage rates still above 6.4%.
- Rate stability is unlocking pent-up demand. Freddie Mac's June 25 PMMS put the 30-year fixed at 6.49%, essentially flat over six weeks. Buyers who had been waiting for rates to fall significantly have adjusted their expectations. Purchase applications have ticked up, and NAR reported existing-home sales rose 3.2% in May nationally. Stability, even at these levels, allows buyers to plan. Volatility was the bigger problem.
- Geopolitical and energy pressures are keeping a lid on the ceiling. The U.S.-Iran conflict has driven energy prices up sharply in 2026. CPI hit 4.2% year over year in May, led by a 40.5% surge in gasoline prices. The Fed held rates steady at 3.50-3.75% in June. That combination, elevated inflation plus a patient Fed, means mortgage rates are unlikely to fall materially before year-end. Buyers and sellers who have priced in a big rate drop are going to be waiting a while.
County Highlights
San Francisco delivered one of the most striking data points in the region. The SFH median reached $2,200,000 in May, up 22.2% from a year ago, with a price per square foot of $1,188. The UII collapsed to 1.1, down from 2.0 a year prior. Homes are selling in 25 days at 124% of list price. For buyers, this is a market with almost no margin for hesitation. For sellers, it is one of the most favorable conditions San Francisco has seen in years. The condo market moves at a different pace, with 47 days on market and a UII of 2.4, but even that inventory index is down 43% from May 2025.
Alameda was competitive and fast. The SFH median came in at $1,400,000, up 2.6% year over year, with homes moving in 13 days and closing at a 104.8% sold-to-list ratio. UII at 2.0 indicates tight supply. The condo segment softened, with the median down 5.8% annually to $695,000 and DOM expanding to 26 days. Buyers looking for relative value in the condo segment compared to SFH will find more breathing room here, though still not a buyer's market by any traditional measure.
Contra Costa showed momentum. The SFH median hit $935,000, up 6.9% month over month and 1.1% year over year, with a UII of 2.3 down sharply from 3.1 a year ago. Homes are clearing in 13 days. The condo market surprised on the upside, with the median up 11.2% year over year to $620,000. For buyers priced out of Alameda or San Mateo, Contra Costa remains the most accessible alternative in the inner Bay Area.
Marin is an interesting split. SFH at $1,810,000 is essentially flat from a year ago, down 4.0% year over year, but homes are taking 54 days to sell. That's the longest median DOM of any of the core competitive counties. Inventory is tighter than last year (UII down 31% annually), but the high price points are limiting the pool of qualified buyers. The condo market actually outperformed, up 7.7% year over year to $820,000, with inventory tightening significantly from the prior year's 5.0 UII down to 3.7. Marin is a market that rewards patience from sellers and precision from buyers.
Napa remains the outlier. SFH median at $927,000, up just 0.8% year over year, but the real story is the 68-day median time on market, up 30.8% from a year ago, and a UII of 6.2. The sold-to-list ratio of 95.2% tells you buyers have real negotiating leverage. This is one of the few Bay Area markets where sellers are consistently receiving below asking. On the condo side, Napa showed a 36% month-over-month price jump to $842,000, but that kind of volatility reflects a very thin and erratic market. Napa moves at a completely different rhythm than the rest of the region.
San Mateo continued its run as one of the Bay Area's most expensive and competitive counties. The SFH median reached $2,401,000, up 9.1% year over year, with a price per square foot of $1,303, also up 12% year over year. Homes sold in 11 days at 105.1% of list price. The condo market was equally strong, with the median up 27.4% year over year to $1,190,000. That year-over-year condo gain is the largest in the region. San Mateo continues to benefit from proximity to major tech employers and limited land for new development.
Santa Clara held steady but showed some softening on the SFH side. The median was essentially flat month over month at $2,100,100 and down 3.3% year over year. Days on market expanded to 11 from 8 last month, and the sold-to-list ratio ticked down to 102%. Inventory remains tight at a UII of 1.9. The condo segment saw a meaningful pullback, with the median down 13.8% month over month to $965,000, though the UII is tighter than last year at 3.2. Santa Clara's SFH market is healthy. The condo market is absorbing a correction.
Solano is the most accessible county in the region, and the data reflects that it's a different market in almost every dimension. The SFH median was $599,950, up 1.7% year over year, but days on market expanded to 47, up 17.5% from last year, and the sold-to-list ratio was essentially at par (99.6%). Buyers have more time, more selection, and more power to negotiate. UII at 3.2 is the highest among the core competitive counties. For first-time buyers or households being priced out elsewhere, Solano offers the most realistic path to ownership.
Sonoma showed modest stability. The SFH median came in at $875,760, up 1.8% year over year, with homes taking 52 days to sell. The UII of 3.5 is down significantly from 4.7 a year ago, indicating some tightening. The sold-to-list ratio was at 100%, meaning sellers are getting their number but not much more. The condo market has softened, with the median off 1.1% from a year ago at $465,000 and days on market jumping to 68. Sonoma has real appeal for buyers who want space, lifestyle, and relative affordability, but it is not a quick-decision market.
Macro Market Overview
Nationally, the housing market gained some footing in May. Existing-home sales rose 3.2% month over month to an annualized rate of 4.17 million, the highest since December. The national median existing-home price reached $429,300 in May, the highest May on record. Inventory grew 3.3% on the month, bringing the supply to 4.5 months at the current sales pace, still below the 5 to 6 months historically associated with a balanced market. NAR Chief Economist Lawrence Yun projects existing-home sales will rise 4% for the full year 2026, with the median price also up 4% annually. The mortgage rate average for 2026 is projected at 6.5%. For buyers sitting on the fence, the message from the national data is consistent: conditions are improving modestly, but not dramatically.
California told a headline-grabbing story in May. The statewide SFH median climbed to $930,260, a 3.1% year-over-year gain, crossing above $900,000 for the second time in 2026 as a record 38.5% of all transactions involved properties priced above $1 million. Sales of homes above $2 million surged 8.5% from a year ago, while the $500,000 to $1 million range softened 3.4%, a clear bifurcation along affordability lines. The C.A.R. forecast called for the statewide median to reach $905,000 for the full year, and the data is tracking ahead of that projection. The state's housing affordability index stood at 22% in Q1 2026, the best reading since 2023, driven by slightly lower rates and modest income gains. Even at 22%, nearly four out of five California households cannot afford the median-priced home. The Bay Area's affordability sits well below the statewide figure. The constraint is structural and deep.
Economic Factors
Inflation accelerated to a three-year high in May. CPI rose 4.2% year over year, led by a 40.5% surge in gasoline prices tied to the U.S.-Iran conflict and its impact on global energy markets. Core CPI, which strips out food and energy, came in at 2.9% year over year, which is elevated but trending more steadily. Shelter inflation, the category most directly tied to housing markets, rose 3.4% annually with a 0.3% monthly gain, half the prior month's pace. The Federal Reserve held the federal funds rate steady at 3.50-3.75% at the June 16-17 FOMC meeting, as expected. The 10-year Treasury yield, the benchmark that most directly shapes mortgage pricing, has been elevated by persistent inflation fears, briefly hitting 5.2% in late May before settling back toward 5.0%. Stock markets have been resilient, and the wealth effect from equity portfolios continues to underpin high-end Bay Area housing demand, particularly in San Francisco, San Mateo, and Santa Clara counties.
The Bay Area tech labor market stabilized after multiple years of correction. AI infrastructure investment has driven headcount increases at several major employers, and venture capital activity is recovering. Unemployment in the region remains below the statewide rate. That employment base is the single most important factor separating Bay Area housing from other California markets. Buyers here have incomes that allow them to absorb rates in the mid-6% range. That is not true in most other parts of the country, and it is why Bay Area price appreciation has diverged so sharply from the national trend.
Mortgage Rates
The 30-year fixed-rate mortgage averaged 6.49% as of June 25, according to Freddie Mac's PMMS, up slightly from 6.47% the prior week. The 15-year fixed averaged 5.84%. A year ago, the 30-year was at 6.77%, so buyers today are getting a modest improvement from last spring. Rates have been remarkably stable over the past six weeks, moving in a tight band between 6.47% and 6.52%. That stability, more than any directional move, has been the catalyst for renewed buyer confidence. Purchase activity eased slightly in the most recent week, while refinance activity picked up, suggesting some borrowers who bought at higher rates are taking advantage of any dip.
What is shaping the rate environment is a standoff between continued inflation and a patient Federal Reserve. The Fed has signaled no urgency to cut in 2026 given the energy-driven CPI acceleration and a labor market that remains solid. MBA, Fannie Mae, and Bankrate forecasts converge around a year-end range of 6.2% to 6.5% for the 30-year fixed, with meaningful rate relief unlikely before 2027. For Bay Area buyers, that means a purchase made today at 6.49% is likely within a quarter point of where rates will be by year-end. Waiting for a significantly lower rate is a strategy with a low probability of payoff, particularly in markets where home prices are rising faster than the interest savings.
Housing Policy and Development
- AB 130 and SB 131 (effective 2026) represent the most significant CEQA overhaul in decades. AB 130 established a new statutory exemption for qualifying infill housing projects on sites of 20 acres or less, dramatically cutting environmental review timelines. SB 131 handles "near-miss" projects that miss a CEQA exemption due to one disqualifying condition, limiting review to only that single issue. For Bay Area developers, these laws reduce entitlement risk and project timelines on urban infill sites.
- SB 79 takes effect July 1, 2026, mandating transit-oriented development density near major transit stations. The law overrides local ordinances to allow denser housing within half a mile of high-frequency rail and bus rapid transit. It also authorizes transit agencies to zone their own property for housing within TOD zones. This will have direct implications for BART-adjacent parcels across Alameda, Contra Costa, San Francisco, and San Mateo counties.
- ADU law continued its evolution in 2026. SB 543 updated interior livable space definitions, exempted ADUs under 500 square feet from school impact fees, and imposed new 15-business-day completeness review timelines on local agencies. AB 1154 eliminated parking requirements for ADUs under 500 square feet. AB 956, pending final passage, would allow homeowners to build two detached ADUs on a single lot, potentially a significant supply tool in built-out suburban neighborhoods.
- SB 9 compliance enforcement tightened. Any local ADU ordinance not timely resubmitted to the California Department of Housing and Community Development is now deemed null and void, with state standards automatically applying. Bay Area homeowners should verify their city's compliance status before beginning any ADU project.
- California's insurance crisis remains a hidden drag on buyer confidence. Legislative responses in 2026 have been incremental, focused on limiting Coastal Commission appeals and ADU insurance timelines, but no comprehensive fix has emerged for the withdrawal of major carriers from high-risk zones. In fire-adjacent areas of Sonoma, Napa, and parts of Marin and Contra Costa, insurance availability is shaping buyer decisions as much as mortgage rates.
- A proposed $11.25 billion housing affordability bond is headed to the November 2026 ballot. If passed, it would provide substantial funding for affordable housing production, infrastructure, and homelessness programs. The long-term implications for Bay Area supply could be significant, but near-term market impact will be limited.
Local Sentiment and Closing
What I am seeing on the ground confirms the data. The well-priced homes in established San Francisco neighborhoods and on the Peninsula are going fast, often with multiple offers, often above asking. The buyers I am working with who waited through 2024 hoping for a rate break have largely stopped waiting. They have recalibrated, accepted the mid-6% environment, and started making real moves. That shift in mindset is real and it is showing up in transaction volume.
The markets I watch more carefully are the ones where sellers still expect 2021-era conditions. Napa and Solano are not those markets right now. Sitting on a listing at an aspirational price and waiting for the right buyer works in San Mateo. It does not work in markets with 47 to 68 days of median DOM. Sellers in those slower markets need an honest conversation about current conditions, not a number from two years ago.
For condos, I am seeing buyers take their time. The divergence between SFH and condo conditions is one of the starkest I have observed in years. If you are buying a condo in San Francisco or Alameda right now, you have more options and more negotiating room than you would in the SFH space. That is worth knowing.
If you are trying to figure out where you stand, whether it makes sense to buy now, sell now, or sit tight, I am happy to walk through the specific numbers for your situation. Reach out anytime.
Categories
Recent Posts


Stay In The Know - Subscribe To Market Updates
LET'S GET IN TOUCH