
San Francisco Bay Area Residential Real Estate Trends: October 2025 Market Report

Market Overview: Steady Conditions Amid Seasonal Rebound
As summer fades, the Bay Area housing market is regaining its rhythm. After a quieter August, September brought a rise in new listings and a return of serious buyers. Statewide, California’s median sale price dipped slightly to $883,640, down 1.7 % from August but still 1.8 % higher than a year earlier. Nationally, the median sale price hovered around $435,495, marking a similar year‑over‑year increase. These figures underscore a market that has cooled from its early‑2022 highs yet remains fundamentally stable. Meanwhile, mortgage rates have drifted down from late‑summer peaks, settling near 6.3 % for a 30‑year fixed loan. Cooling inflation and expectations of a more cautious Federal Reserve have helped ease borrowing costs, even as strong employment and solid consumer spending continue to support demand.
Single‑Family Homes: Divergent Market Dynamics by County
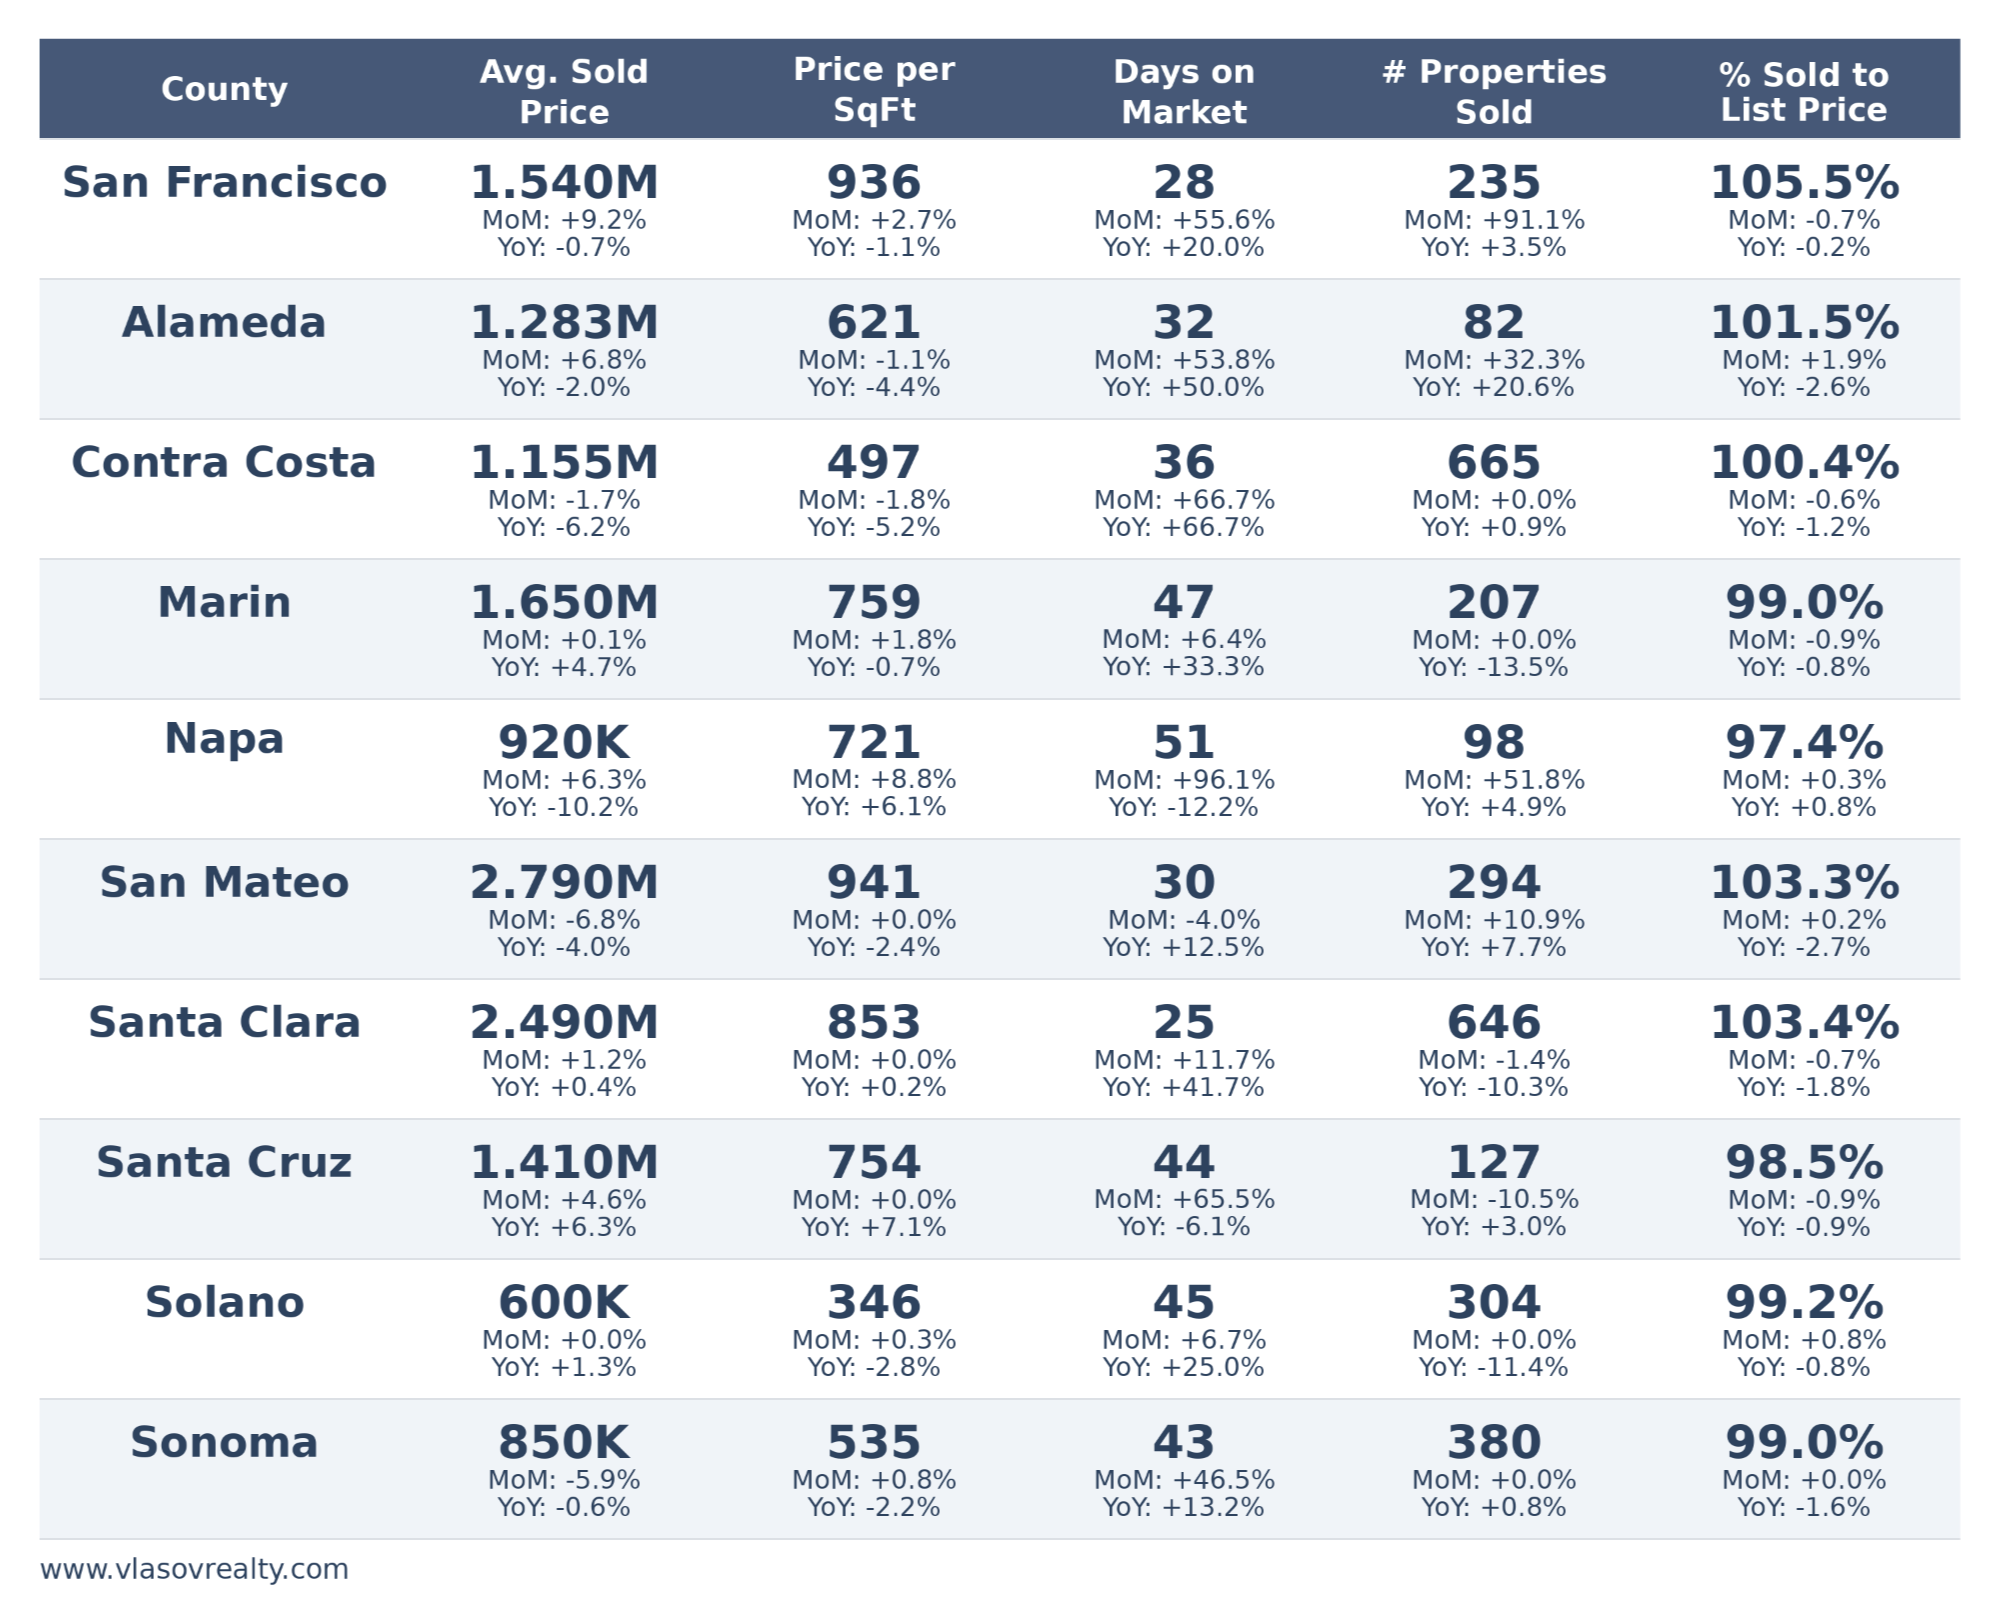
September’s data reveal clear tiers across the Bay Area in terms of price, pace, and competitiveness. The Peninsula counties of San Mateo and Santa Clara again topped the charts: average single‑family sale prices were about $2.79 M and $2.49 M, respectively, and homes still fetched roughly 103 % of their list prices. Despite a modest month-over-month dip, these markets remained highly competitive, with homes selling in approximately 25–30 days. San Francisco followed at an average of $1.54 M, still commanding the region’s highest sale‑to‑list ratio (about 105 %) and a brief 28‑day median time on market. Even with inventory slightly higher than in August, buyers here must act decisively when well‑priced homes hit the market.
The East Bay showed more balanced conditions. In Alameda County, the average sale price was around $1.28 M, up modestly from August but down year‑over‑year. Homes took roughly 32 days to sell, and the sale-to-list ratio rose to 101.5%, indicating steady demand despite higher mortgage rates. Contra Costa County posted an average price near $1.16 M and maintained sale‑to‑list ratios around 100 %. The days on market lengthened to about 36 days, suggesting a more deliberate pace and increased negotiation room.
In the North Bay, patterns diverged. Marin County’s average price edged up to $1.65 M, but extended marketing periods (around 47 days) and sale‑to‑list ratios just below 100 % point to a calmer pace. Napa County averaged $920 K and saw a notable jump in days on market, while sale‑to‑list ratios hovered below 98 %. Solano and Sonoma counties remained the region’s most affordable, with average prices of around $600,000 and $850,000; however, days on market climbed into the mid-40s, underscoring buyer patience and measured demand. Santa Cruz County sat between these extremes: its average price was approximately $1.41 million, and homes spent an average of roughly 44 days on the market. Overall, these counties offered more opportunities for negotiation and are attractive to buyers seeking larger lots or a quieter lifestyle.
Condos & TICs: Mixed Signals Across the Region
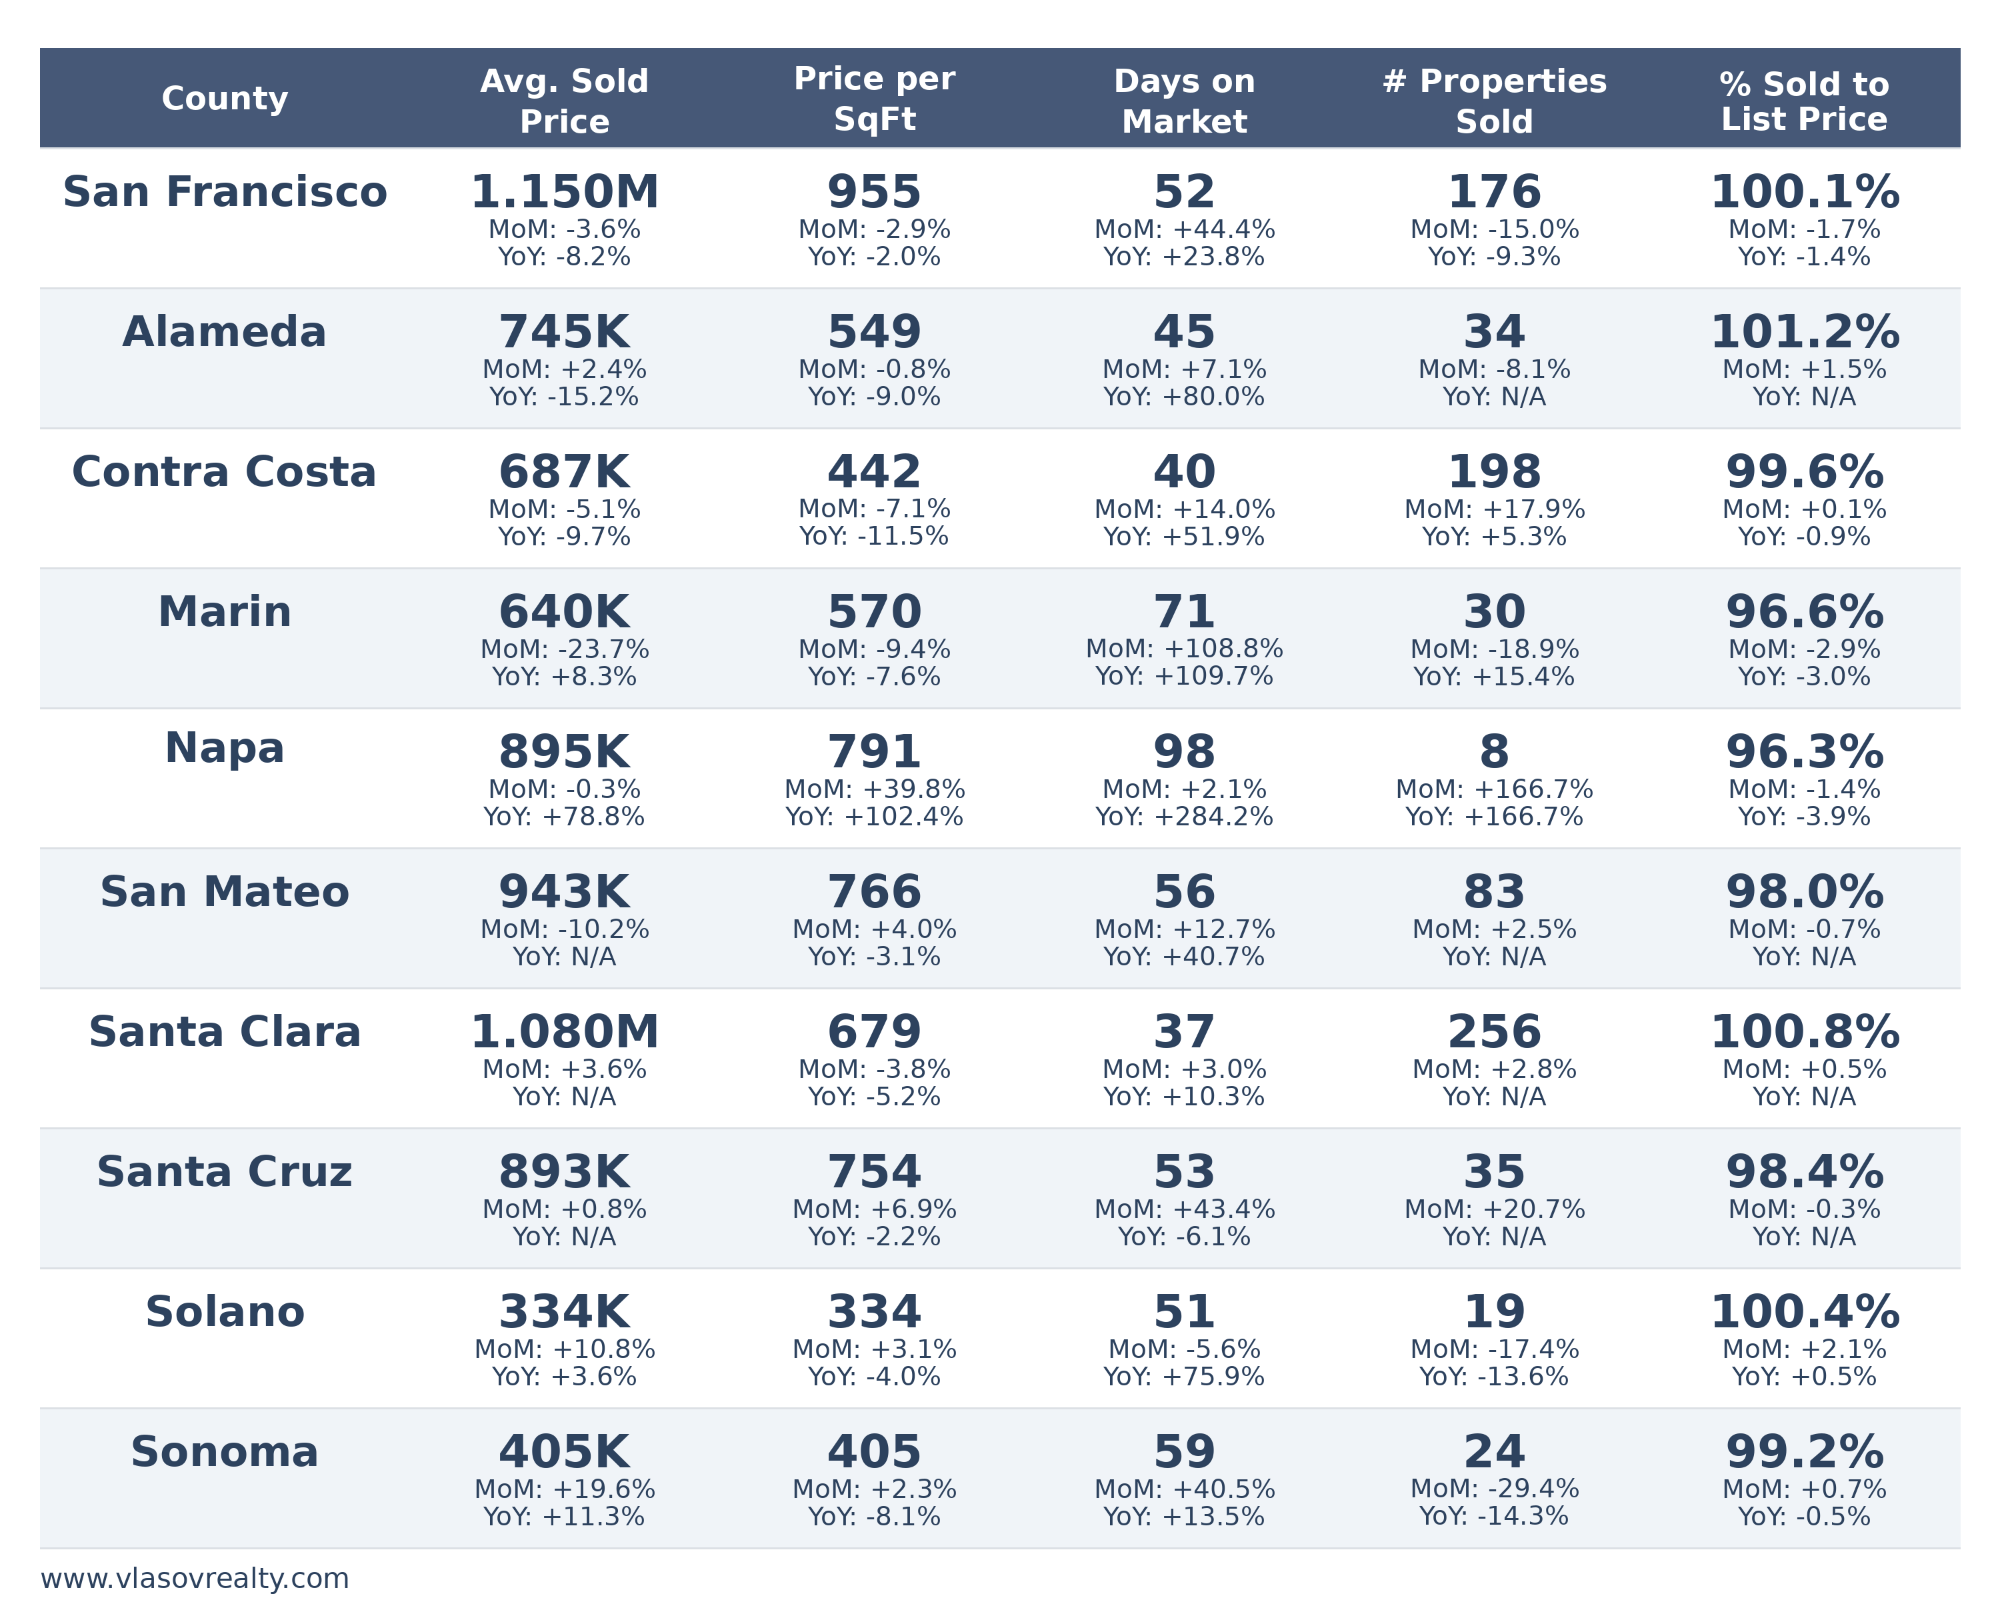
Condo and TIC markets displayed a wider range of performance. San Francisco remained the priciest, with an average sale price of $1.15 million, although sales volumes declined, and homes took approximately 52 days to sell. The sale‑to‑list ratio dipped to 100.1 %, reflecting slightly softer demand. Santa Clara stayed strong with an average condo price of about $1.08 M, a sale‑to‑list ratio near 101 %, and a 37‑day marketing period. By contrast, Alameda and Contra Costa offered more attainable averages ($745 K and $687 K) and moderate days on market (around 45 and 40 days), yet sale‑to‑list ratios remained just above or just below 100 %, indicating balanced conditions.
The North Bay delivered the broadest variation: Marin averaged $ 640,000 with long marketing periods (~71 days) and sale-to-list ratios under 97%. Napa’s average condo price rose to $895 K and posted dramatic year‑over‑year gains, but days on market surged to nearly three months and volumes remained tiny, underscoring volatility. Solano and Sonoma offered the lowest condo price points—around $334,000 and $405,000—with balanced sale-to-list ratios near 100%, though sales volumes were modest and days on market varied widely. Overall, the condo sector provided entry points for buyers priced out of single‑family homes but showed high dispersion based on location and inventory.
Single Family Homes
Condos and TICs
Bigger Picture and Mortgage‑Rate Environment
September’s statewide and national data suggest a housing market that has cooled from the pandemic frenzy but remains healthy. California’s median sale price slipped month‑over‑month yet held above year‑ago levels, while U.S. home prices posted similar year‑over‑year gains. The key balancing factor is mortgage rates: after spiking during the summer, the 30‑year fixed rate eased to around 6.3 %, thanks largely to moderating inflation and expectations that the Federal Reserve will slow its pace of rate hikes. Nevertheless, strong employment and consumer spending have prevented rates from falling dramatically. Lenders and investors continue to monitor economic data, meaning rates may fluctuate within a narrow band but are unlikely to drop significantly without a clear slowdown in growth.
Looking Ahead
The early fall rebound confirms that Bay Area housing remains desirable despite higher borrowing costs. Supply constraints persist, especially in premium counties like San Francisco, San Mateo, and Santa Clara, keeping prices elevated and competition brisk. Markets in the East Bay and North Bay are more balanced, with longer marketing periods and sale‑to‑list ratios around 100 %, offering a level of bargain. Condos provide a diverse landscape of affordability and volatility, reflecting location‑specific supply and demand. As the year progresses, watch for incremental shifts in mortgage rates, inventory and buyer sentiment; these factors will shape how the market closes 2025.
Categories
Recent Posts


Stay In The Know - Subscribe To Market Updates
LET'S GET IN TOUCH